Andrew Hallam
29.01.2021
Stock Market Solutions To Irrational Exuberance
_
The teacher sits at her desk, grading test results. A blonde charismatic kid who finishes every test first didn’t answer many questions right, but the teacher scribbles A+ on the paper anyway. There’s a new kid at the front. He gets half the questions right, but he looks a bit like the teacher’s Mensa-level nephew, so he gets an A+ too.
Now on a roll, the teacher gifts every kid a score far above the merit weight. Month after month, the teacher does the same thing. Some of the parents say, “My kid’s a genius.” But the wise ones know better. They wonder, “What kind of carnage will we face at home when my child’s grade, once again, is a reflection of achievement?” It’s much the same with stocks today.
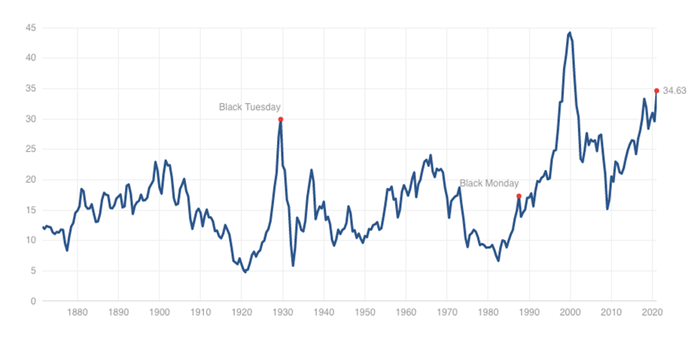
Former Federal Reserve Chairman, Alan Greenspan, popularized the term, “Irrational Exuberance” in 1996. He meant that stocks were priced sky-high compared to their corporate earnings. The S&P 500 had a CAPE (Cyclically-Adjusted-Price-To-Earnings) ratio of about 25 times earnings.
Historically, U.S. stocks trade at an average CAPE ratio of about 16 times earnings. But CAPE levels shift. For example, stock prices punched far above their weight in the late 1920s. It was a period that writer, F. Scott Fitzgerald called, The Jazz Age. People partied and danced, Jay Gatsby style, while the CAPE ratio soared to 30 times earnings.
After the 1929 stock market crash, people were more cautious. To bring the analogy back to the classroom teacher, from 1930 to about 1955, she gave C+ letter grades to kids who scored 98 percent. It wasn’t until the 1960s when exuberance arrived again, fueled by a surge in technology stocks.
In the late 1950s, a young Warren Buffett started a limited partnership that he ran much like a hedge fund. He earned spectacular returns, but by the late 1960s, he decided to close shop. Stock prices had risen far faster than business earnings and he said he couldn’t find reasonably priced stocks. In 1969, he gave the investors’ money back with the CAPE ratio sitting at about 24 times earnings.
Yale Economics professor, Robert Shiller, found that when CAPE ratios greatly exceed their long-term average (about 16 times earnings) stocks usually perform badly in the decade ahead.
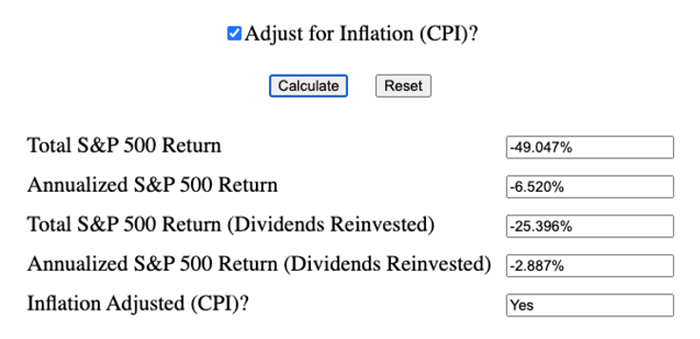
Ten years after Buffett closed his limited partnership in 1969, a box of Cheerios would have beaten U.S. stocks. And that’s no joke. Imagine if you had $200 in 1969. You decided to invest $100 in a diversified basket of U.S. stocks that equaled the return of the S&P 500. With the other $100, you bought multiple boxes of breakfast cereal. Ten years later, in 1979, you sell the stocks and the stale cereal (nobody complained until after they ate them). The “investment” in the cereal matched inflation…and that trounced the S&P 500. After inflation, the S&P 500 dropped its buying power by about 25.39 percent, including all reinvested dividends.
High Stock Prices Precipitate a Low Decade Return
1969-1979

The CAPE ratio is the most reliable indicator of future decade-long returns. When stocks are priced far below its long-term average, stocks typically soar in the decade ahead. When stocks are priced far above the long-term CAPE average, a poor decade almost always lies ahead.
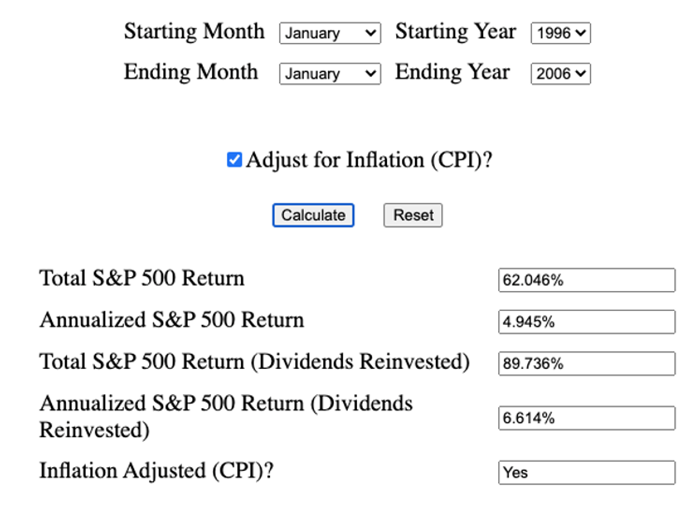
On January 13, 2021, U.S. stocks hit a nosebleed CAPE ratio of 34.63 times earnings. That might tempt some investors to sell stocks for gold, bonds or cash. But here’s why we shouldn’t speculate. Former Federal Reserve Chairman, Alan Greenspan was (and still is) a really smart guy. In 1996, when he referred to market levels as irrationally exuberant, they traded at a CAPE ratio of 25 times earnings. The decade that followed saw a lot of volatility, including the market crash in 2001. But over the ten-year period from January 1996 to January 2006, U.S. stocks avenged their defeat to breakfast. After an adjustment for inflation, they gained 89.73 percent.
When High Prices Didn’t Slow Down Stocks
1996-2006

Source: https://dqydj.com/sp-500-return-calculator/
When it comes to investing, anything can happen. Stocks will often be priced far higher than they should. But nobody can see the future. That’s why investors shouldn’t speculate. They should maintain a diversified low-cost portfolio of U.S. stocks, developed international stocks, emerging market stocks and bonds. They should maintain a consistent allocation and rebalance (if needed) once a year. Such a portfolio will beat the pants off most speculators. After all, investing isn’t a sprint. It’s an ultra-marathon that will grade each investor on their long-term patience.
Andrew Hallam is a Digital Nomad. He’s the author of the bestseller, Millionaire Teacher and Millionaire Expat: How To Build Wealth Living Overseas
Swissquote Bank Europe S.A. accepts no responsibility for the content of this report and makes no warranty as to its accuracy of completeness. This report is not intended to be financial advice, or a recommendation for any investment or investment strategy. The information is prepared for general information only, and as such, the specific needs, investment objectives or financial situation of any particular user have not been taken into consideration. Opinions expressed are those of the author, not Swissquote Bank Europe and Swissquote Bank Europe accepts no liability for any loss caused by the use of this information. This report contains information produced by a third party that has been remunerated by Swissquote Bank Europe.
Please note the value of investments can go down as well as up, and you may not get back all the money that you invest. Past performance is no guarantee of future results.

