3.4 Trends
Become proficient at identifying and predicting economic trends. In this video, you will familiarize yourself with concepts such as uptrends, downtrends, horizontal trends or timeframes, and will learn how to analyze the speed and size of trends by using indicators such as the Relative Strength Index.
Complete this course


Script
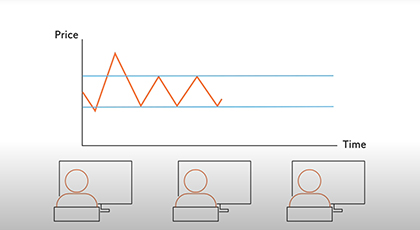
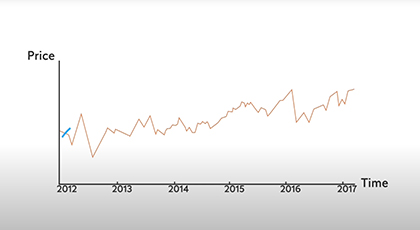
Technical analysis is based on the premise that future prices can be predicted.Sometimes, prices indeed seem to move predictably upwards or downwards. Traders say the prices trend, and speak of uptrends and downtrends as well as horizontal trends.Trends can apply to various time frames. Some day traders speak of trends in minutes, while other traders think of trends in months…or even years.Traders often identify trends by adding moving average lines to their charts. A moving average simply means that the calculation changes with time. A short time frame follows the price more closely than a longer time frame. In addition to moving averages, information about the speed and size of price movements are also used to gauge the strength of trends. This analysis is generally done using the so-called Relative Strength Index, or RSI. When the RSI goes over 70, the asset is overbought and might present an opportunity for a short trade. On the other hand, when the RSI goes under 30, the asset is oversold and might present an opportunity for a long trade. Many traders use price patterns that occur in the chart to spot opportunities to trade. For example, double or triple tops or bottoms, or the so-called head and shoulders patternIn addition to determining a trend, price patterns can help identify reversal points and even estimate the size of a market correction. For example, say a price has been moving in a so-called channel for a while. If the price breaks out of the channel, something has happened – and the market must find a new level. Often, there is much volatility when the price breaks through a previous level, while the market participants figure out what happened and what they believe that means. Sometimes, such new levels can be predicted somewhat by looking at what happened previously, for example by examining price patterns. To learn more about long-term trends, watch the video about fundamental analysis.