3.3 Support & Resistance
Support and resistance levels are the price point that a given asset seems to have difficulty in breaking through. Learn how to identify these two levels – key concepts for traders.
Complete this course


Script
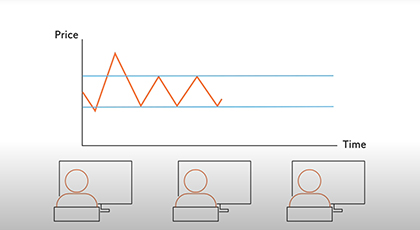
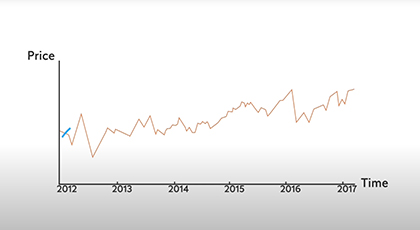
Technical traders often base trades on Support and Resistance levels. These are price points that a given asset, for example a currency pair or CFD, seems to have difficulty in breaking through. A price may have only one Support level, and only one Resistance level. Indeed, a financial instrument can trade in a so-called channel between both! Support and resistance levels are often round numbers that act as psychological barriers. Pay extra attention as the price nears the support or resistance level. Something may have changed for the currency pair or in the outlook of traders – and once a price breaks through a Support or Resistance level, it may vary wildly until traders find a new consensus. Note that both support and resistance levels can be self-fulfilling. For example, when a currency pair nears a resistance level it has met several times, many traders start selling the base currency, thus expanding supply and lowering the price. The same thing may happen in reverse. When a currency pair nears a support level, traders begin to buy it, expecting the price to go up soon and wishing to get in early. To gauge the strength of Support and Resistance levels, many traders include information about price movements and trends in their charts. Since it is difficult and time-consuming to analyze charts manually, your trading platform includes many so-called technical indicators that include, for example, moving averages or Bollinger Bands. To get started, open a chart in your trading platform and add an indicator. If you wish to combine technical analysis with fundamental analysis, watch the videos introducing fundamental analysis and trading strategies.